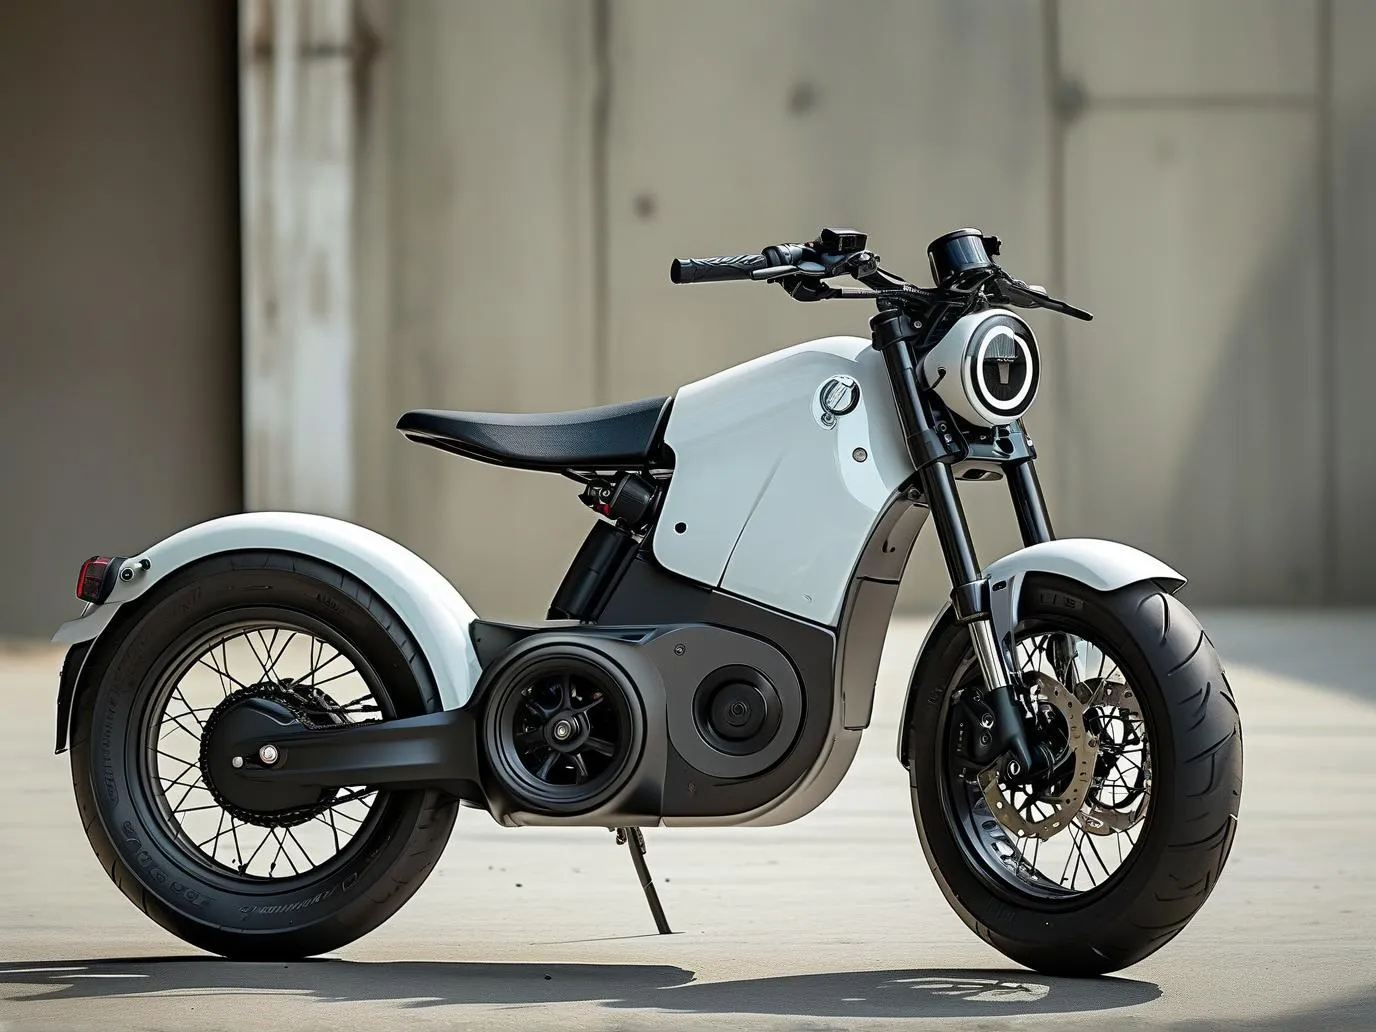
Navigating crowded city streets demands efficient transportation solutions. For urban riders weighing options between two-wheel motorbikes and lightweight commuter bikes, understanding key differences in performance, practicality, and cost proves essential for making informed decisions.
Speed and Efficiency in Urban Terrain
Gas-powered motorbikes typically deliver 50-125cc engines capable of reaching 35-60 mph, enabling faster commutes across longer distances. According to 2023 data from the U.S. Department of Transportation, average motorbike speeds in cities exceed car traffic by 16% during peak hours. However, lightweight bicycles requiring human power maintain steady 10-15 mph paces – practical for trips under 5 miles but physically demanding for extended routes.
Operational Costs Breakdown
Annual ownership expenses reveal stark contrasts:
– Motorbikes: $1,200-$2,500 (fuel, insurance, maintenance)
– Commuter Bikes: $150-$400 (maintenance/accessories)
MIT’s Urban Mobility Lab 2024 study shows bicycle commuters save $8,460 annually compared to motorized alternatives when factoring parking fees and time-value calculations.
Environmental Impact Comparison
Pedal-powered bicycles produce zero emissions versus motorbikes’ average 72g CO2/km output (European Environment Agency). Cities like Amsterdam demonstrate bicycle infrastructure reduces traffic emissions by 28% – a crucial consideration for eco-conscious commuters.
Parking and Storage Solutions
Cycle storage proves significantly simpler:
– Bicycles: Standard racks/indoor storage
– Motorbikes: Requires dedicated parking spaces (costing $100-$300 monthly in NYC)
Urban planner Jane Wilcox notes: “Bike-share programs now cover 85% of central business districts versus only 40% offering motorcycle parking.”
Safety Metrics and Accident Rates
NHTSA reports show per-mile accident rates:
– Motorbikes: 35 incidents per million miles
– Bicycles: 9 incidents per million miles
However, protected bike lanes reduce cyclist accidents by 41% where available (Johns Hopkins Urban Health Study).
Adaptability to Infrastructure
Cargo capacity differs substantially:
– Motorbikes: Carry 40-100 lbs with luggage racks
– Bicycles: Limited to 20-50 lbs without trailer attachments
Emerging e-bike models now match some motorbike capacities while maintaining bicycle privileges in pedestrian zones.
Maintenance Requirements
Service intervals contrast sharply:
– Motorbikes: Professional servicing every 1,000-3,000 miles
– Bicycles: User-maintained with monthly checkups
Auckland University’s transport study found cyclists spend 82% less time on vehicle maintenance annually.
Optimal Choice Guide
| Factor | Motorbike Advantage | Bicycle Benefit |
|———————-|——————————|——————————-|
| >10 mile commute | ✔️ Faster sustained speed | ❌ Physically taxing |
| Tight budget | ❌ Higher costs | ✔️ Minimal expenses |
| Hill terrain | ✔️ Engine-powered ascent | ❌ Requires fitness |
| Eco-priority | ❌ Emissions | ✔️ Zero footprint |
Urban commuters should assess route length, budget constraints, and fitness levels. Hybrid e-bikes now bridge gaps for riders needing occasional motor assistance without full motorbike commitments. Recent market analysis shows e-bike sales surpassing traditional motorcycles in seven major U.S. cities – a testament to evolving urban mobility preferences.


Leave a Reply